98 lines
3.8 KiB
Markdown
98 lines
3.8 KiB
Markdown
# Prometheus Frigate stats exporter
|
|
|
|
This is a docker container that runs a Prometheus exporter for [Frigate](https://frigate.video/) stats.
|
|
|
|
Tested with ghcr.io/blakeblackshear/frigate:0.12.0-beta8 docker image with a single Intel OpenVINO detector.
|
|
|
|
[Docker Hub](https://hub.docker.com/r/rhysbailey/prometheus-frigate-exporter)
|
|
|
|
[GitHub](https://github.com/bairhys/prometheus-frigate-exporter)
|
|
|
|
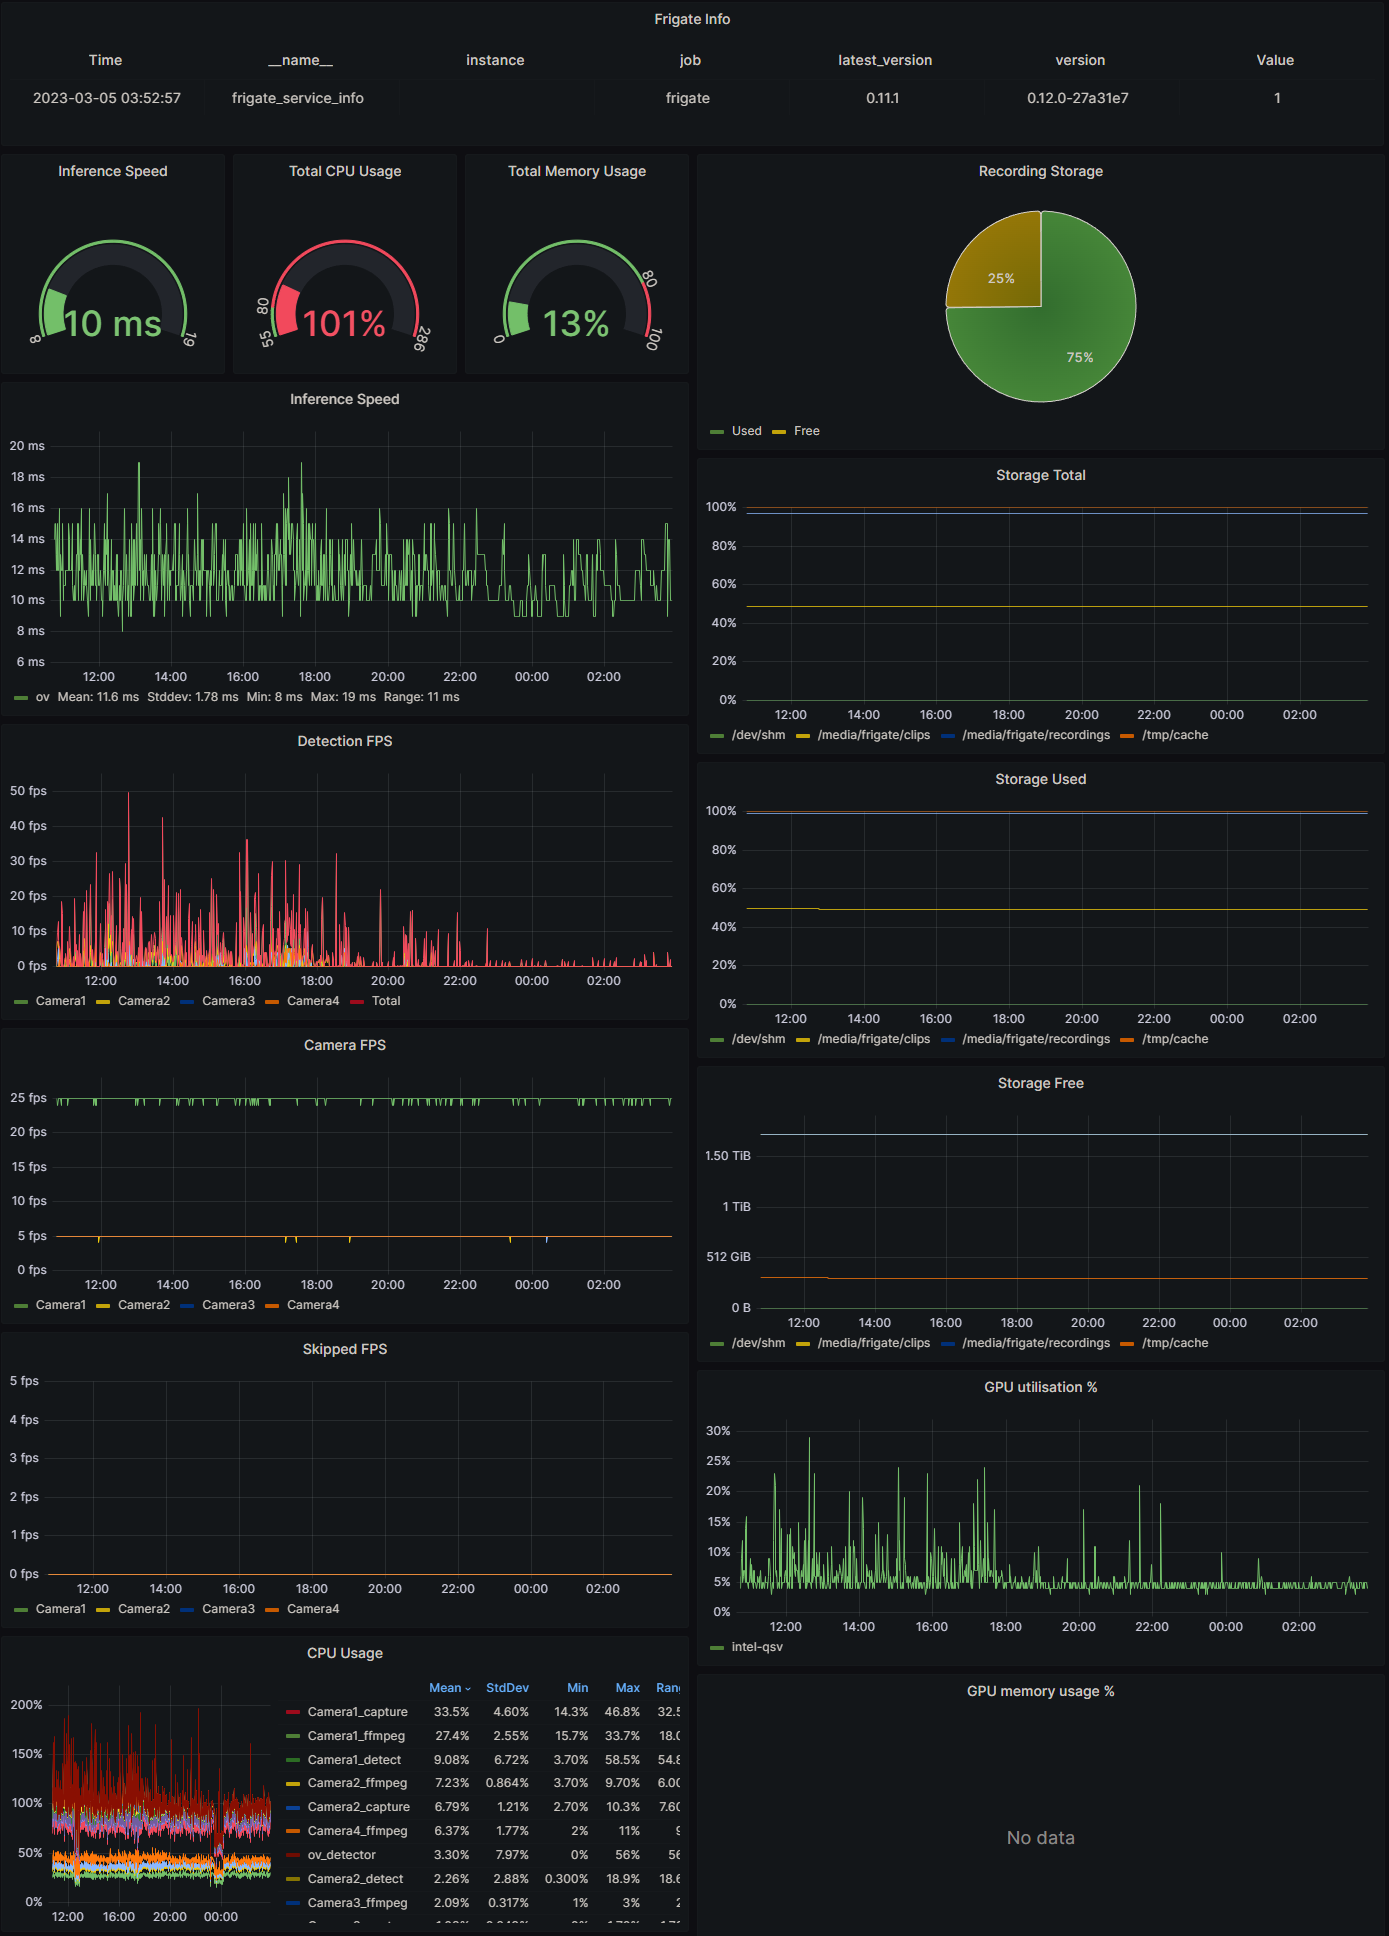
[Grafana Dashboard](https://grafana.com/grafana/dashboards/18226-frigate/)
|
|
|
|
|
|
|
|
## Run the exporter
|
|
|
|
Modify the `FRIGATE_STATS_URL` environment variable below to point to your [Frigate API stats](https://docs.frigate.video/integrations/api#get-apistats) (replace `<your-frigate-ip>` with your Frigate docker container IP address). Then run the container:
|
|
|
|
```bash
|
|
docker run \
|
|
-d \
|
|
--restart unless-stopped \
|
|
-p 9100:9100 \
|
|
-e "FRIGATE_STATS_URL=http://<your-frigate-ip>:5000/api/stats" \
|
|
--name prometheus_frigate_exporter \
|
|
rhysbailey/prometheus-frigate-exporter
|
|
```
|
|
|
|
Metrics are available at http://localhost:9100/metrics
|
|
|
|
### Setup Prometheus
|
|
|
|
If you don't already have Prometheus set up to scrape the `prometheus-frigate-exporter` metrics,
|
|
|
|
- create Prometheus config file `prometheus.yml`
|
|
- copy example below into `prometheus.yml`, replacing `<your-prometheus-frigate-exporter-ip>` with the IP address of your `prometheus_frigate_exporter` docker container. `<your-prometheus-frigate-exporter-ip>` is likely the same IP address as your Frigate docker containers `<your-frigate-ip>` if running in the same docker instance
|
|
```yaml
|
|
# my global config
|
|
global:
|
|
scrape_interval: 15s # Set the scrape interval to every 15 seconds. Default is every 1 minute.
|
|
evaluation_interval: 15s # Evaluate rules every 15 seconds. The default is every 1 minute.
|
|
# scrape_timeout is set to the global default (10s).
|
|
|
|
# A scrape configuration containing exactly one endpoint to scrape:
|
|
# Here it's Prometheus itself.
|
|
scrape_configs:
|
|
# The job name is added as a label `job=<job_name>` to any timeseries scraped from this config.
|
|
- job_name: "prometheus"
|
|
static_configs:
|
|
- targets: ["localhost:9090"]
|
|
|
|
- job_name: "prometheus_frigate_exporter"
|
|
static_configs:
|
|
- targets: [
|
|
"<your-prometheus-frigate-exporter-ip>:9100"
|
|
]
|
|
```
|
|
|
|
- Run Prometheus docker container by replacing `/path/to/prometheus.yml` to point to the `prometheus.yml` just created
|
|
|
|
```bash
|
|
docker run \
|
|
-d \
|
|
--restart unless-stopped \
|
|
-p 9090:9090 \
|
|
-v /path/to/prometheus.yml:/etc/prometheus/prometheus.yml \
|
|
prom/prometheus
|
|
```
|
|
|
|
To see if Prometheus is scraping the Frigate exporter, go to Prometheus targets page [http://<your-prometheus-ip>:9090/targets]() and look for `UP` for `prometheus_frigate_exporter` job.
|
|
|
|
### Setup Grafana
|
|
|
|
If you don't already have Grafana set up,
|
|
|
|
- run Grafana
|
|
|
|
```bash
|
|
docker run \
|
|
-d \
|
|
--restart unless-stopped \
|
|
-p 3000:3000 \
|
|
grafana/grafana-oss
|
|
```
|
|
|
|
- Go to Grafana [http://<your-grafana-ip>:3000]() (might take a few minutes first run). Use admin:admin to log in
|
|
- Go to [http://<your-grafana-ip>:3000/datasources]()
|
|
- add Prometheus datasource
|
|
- Set Prometheus URL `http://<your-prometheus-frigate-exporter-ip>:9090`
|
|
- Click `Save and Test` to check if connected
|
|
- Go to [http://<your-grafana-ip>:3000/dashboards]()
|
|
- New -> Import
|
|
- Enter in `Import via grafana.com`: `18226` (can be found at [Grafana Dashboard](https://grafana.com/grafana/dashboards/18226-frigate/)) and click Load
|
|
- Set the datasource as Prometheus instance set up before then click Import
|
|
- Should now be able to see Frigate time series metrics in the Grafana dashboard
|
|
|
|
|